Improving the quality of healthcare in intensive care units. The PADRIS programme in the Tarragona Datathon 2018 (part two)

14 Feb

Today we continue the interview with Maria Bodí (@mariabodi23), doctor at the Intensive Medicine Service, and Josep Gómez (@JosepGomezAlvarez), doctor in Biotechnology at the Hospital Universitari de Tarragona Joan XXII, experts in clinical management and aspects of quality and safety in healthcare.

Josep Gómez, María Bodí

In your opinion, what are the conclusions of the so-called Real World Data studies which were carried out using real data in terms of benefits and risks related to patient safety?

Benefits? Everything. Information derived from a real healthcare environment is necessary to take decisions. Randomised clinical trials which have defined the effectiveness and safety of therapeutic interventions have served till now as a Gold Standard of the best scientific evidence. But they are very costly, and what is more, they are aimed at very selective groups of patients. Studies and analyses derived from the real world, known as Real World Data, mean it is possible to know the effectiveness and safety of interventions in groups of patients which are usually excluded from trials (pregnant women, older people, patients with many comorbidities who are the majority, etc…).

There is a series of limitations and obstacles that prevent Real World Data from substituting clinical trials. On the one hand, legal and ethical aspects and those concerning the guarantee of the quality of data. On the other, it is not possible to accept the bias that there is when not randomising Real World Data. Before taking decisions, we need to ensure that there are no confusing factors.

Real World Data complements the information obtained from clinical trials in routine clinical practice.

Some weeks ago we received the visit of Lucian Leape in Barcelona, author of the extremely famous book “To Err is Human”. We were fortunate to be able to listen to him in a talk at AQuAS – were you able to listen to him?

No, unfortunately we were not able to attend. It is a pity because we were told that it was a good review of what we have learnt in the past two decades in the field of clinical safety and that some good recommendations were made for the future.

In your opinion, what contributions did the To Err is Human report, published 20 years ago, make?

It revolutionised the field of safety. It was a paradigm shift which is still in place today.

The To Err is Human report denounced the thousands of deaths in the United States resulting from adverse events which could have been avoided! People who were dying in hospitals for reasons unrelated to the disease for which they had been admitted. The most important thing is that those events, those deaths, could have been avoided. Better training, better work organisation, knowing and analysing risks and teamwork, among other factors, have been shown to be key elements that contribute to reducing the amount of events and their severity.  

What impact has the PADRIS programme had on your day to day?

In 2016, MIMIC-II was published, a huge set of de-identified data of ICU patients of the Harvard Medical School. It was created and has been maintained by researchers at the Massachusetts Institute of Technology. They published this dataset with the aim of democratising research. The idea is that after attending a training course on the treatment of data for research, you are certified as a practising researcher and you sign a document of usage: ultimately, to enable a researcher to have access to a large data base to carry out research. In addition, it encourages researchers to share the code (data processing methodology) that they have applied to data to obtain the results they publish. Altogether, it makes studies more transparent and repeatable which in turn increases the excellence of scientific production.

As a result of our experience in extracting data from the clinical information system to develop our management tool of the unit, we took on the challenge of generating our own data base to carry out research. Once created, we contacted the PADRIS programme so they could advise us regarding data anonymisation protocols and methodologies to get access to the programme in order to carry out research. They showed great interest in our project at all times and they helped us see it to fruition and thus the role of the PADRIS programme was decisive in making the Datathon Tarragona 2018 possible. We are in fact still in contact with them to define future strategies about how to make this data available for research projects without infringing any data protection law and how to broaden the database with data from other ICUs in the Catalan territory.

If you could make a recommendation to other researchers who wish to do research, what would it be?

We recommend they collaborate with experts in other fields, especially those related to data and statistical technology. We are now reaching a level of sophistication and volume of data that obliges us to work in multidisciplinary teams in order to make the most of data and to understand it the best we can. The datathons are a great example of this; the role of the clinician is decisive in defining aims and in validating the results that appear when cutting edge algorithms are applied by data scientists. At the same time, the role of data scientists is also decisive when suggesting and applying complex methodologies which are far removed from traditional statistics applied within a clinical context.

What professional challenge would you like to succeed with in 2019?

The ultimate professional challenge for 2019 is the same as each year: improving the care given to patients which are admitted to an ICU. To achieve this, we have some very specific challenges in our unit. On the one hand, to continue developing our tool to exploit data which enables us to analyse processes and the results obtained in our day to day and in this way become aware of where we need to place our attention to make improvements. On the other hand, taking advantage of the secondary use of data to carry out research and to generate algorithms for automatic learning which are able to help a doctor take the most accurate and appropriate decisions based on the profile of each disease.

 (You can read the first part of this interview here)


Mendeley, from reference manager to discovery tool and scientific visibility

25 May
Paula Traver

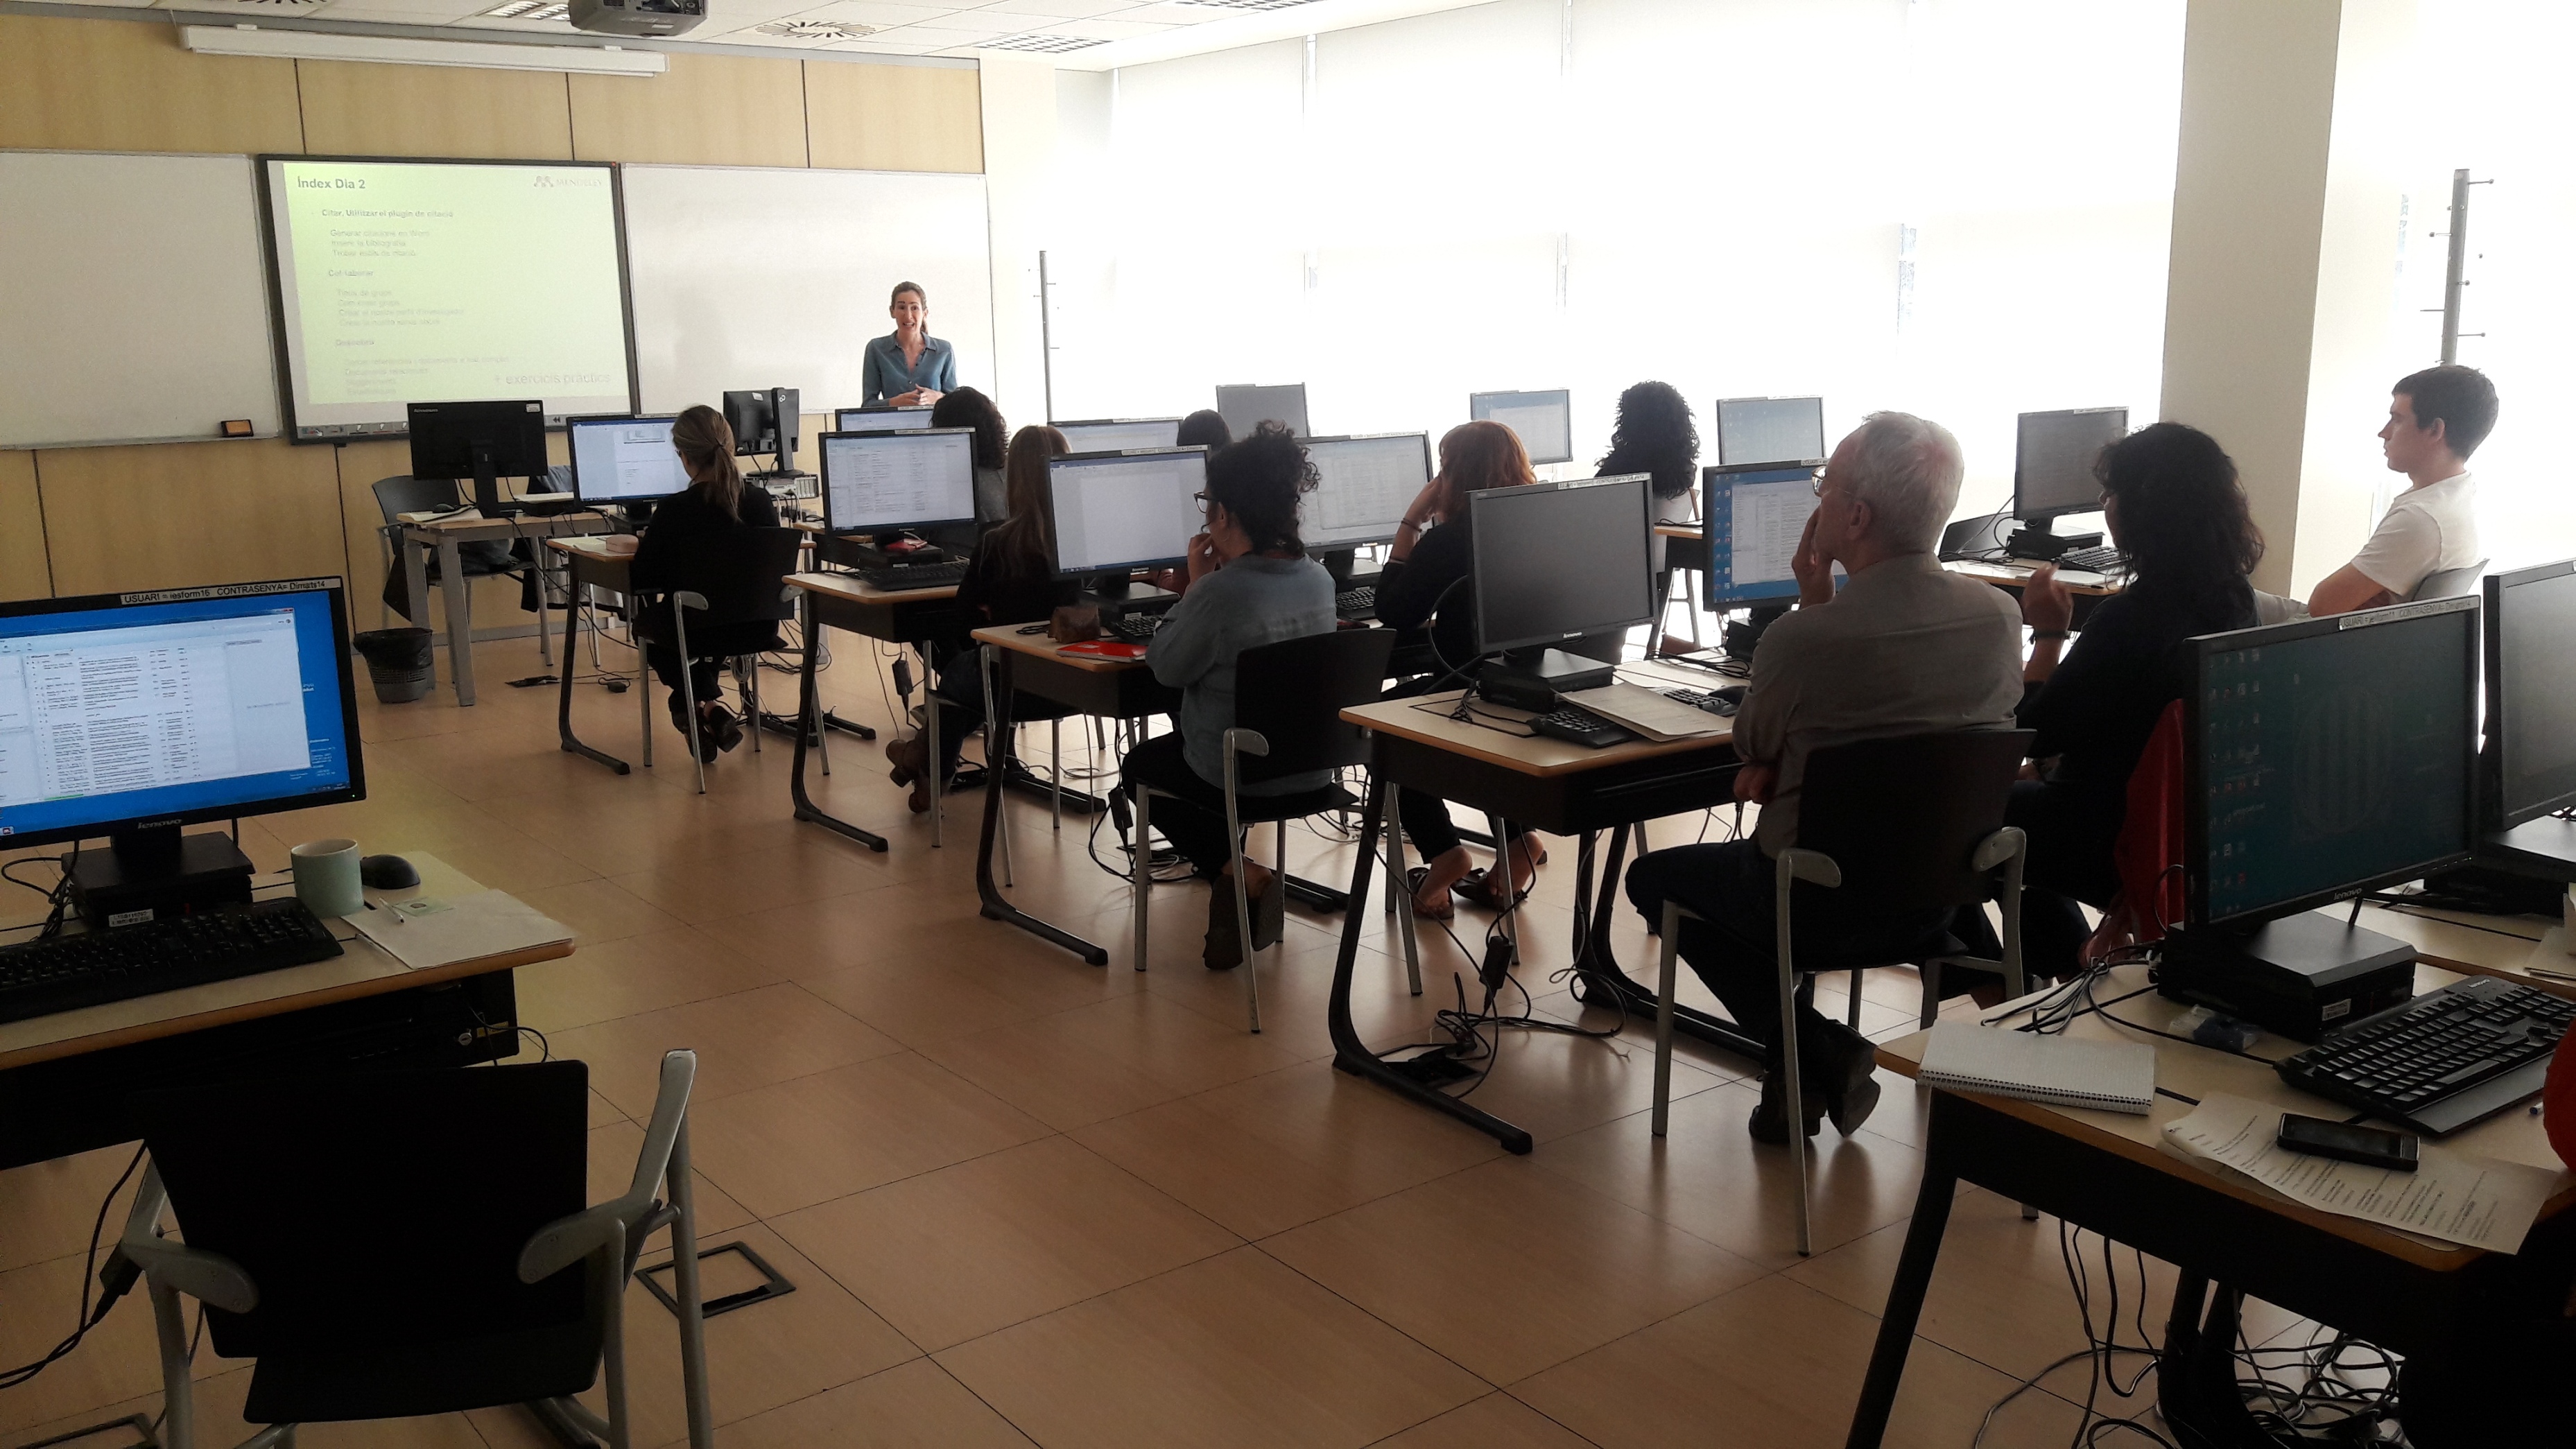
Last week, I had the pleasure of being in Barcelona leading a workshop about Mendeley to the staff at AQuAS. It took place on the 16 and 17 May and a total of 20 people attended among which there were researchers, librarians and administrative staff.

In this workshop, I talked about the features of Mendeley, which is basically a reference manager that allows us to manage a bibliography in an automated way, with the advantage of it being free multiplatform software which operates on the cloud. Thanks to the Web Importer plugin, we can automatically import references from the browser that we habitually use in a very simple way. Thus, together with other ways of adding information, we build up our library, which is not only able to contain references but also pdf documents that we can read directly thanks to the PDF Viewer. What is more, Mendeley extracts metadata from these documents so that we have all this data automatically available as a bibliographic reference.

We had a look at all the possibilities there are of organising our library and recovering information in an intuitive manner. Following that, I explained the features of the quotation plugin, which works both for Word as well as for LibreOffice and serves to facilitate the insertion of quotations in the text processor when we are writing up a project, an article, a book, a report, etc … It also allows us to generate a bibliography automatically, choosing the style of quote we want to use (Vancouver, APA, Harvard, or the specific style of a magazine with specific requirements for the bibliography).

Mendeley desktop

Beyond all these features which are characteristic of many management tools (each with their own peculiarities), I wanted to explore the 2.0 philosophy that surrounds this tool in more depth because the truth is that Mendeley is more than a manager of bibliographic references. Firstly, because its mere existence is the result of collective intelligence as the Mendeley catalogue is made up of references provided by users and it is built by everyone together. Secondly, because it encourages collaboration and teamwork, and thirdly, because Mendeley  also has a social network where we can create our researcher profile and connect with other people.

Mendeley Workshop at AQuAS – May 2017

We thus saw the possibilities of creating groups to share references and documents, which can even contain annotations and highlighted text. This is without doubt a very interesting feature for research groups, although in the free version, this is limited to three users and to private groups.

Regarding the functionality of Mendeley as a social network, we saw the possibility of creating our profile as researchers, adding one’s own publications, which immediately become part of the Mendeley catalogue. This is a fantastic opportunity to improve online reputation by disseminating one’s papers or sharing them with groups to who they might be of interest. From here on, we can connect with other people having similar interests to ours, and see all their activity and news on the ‘feed’.

Lastly, we also saw the possibilities we have of discovering academic information on  Mendeley. Using the references stored in our library, the tool gives us suggestions of other references that could be of interest. It also suggests people to follow and allows us to search for similar documents that we already have.

Apart from giving a detailed explanation of these features of  Mendeley, we practised with exercises on the computer so as to take in all these concepts and the response of the attendees was very positive. In general, the tool seemed to be very intuitive and useful, especially in terms of working on the cloud from any place or device, having a repository of documents available and the ease of creating groups and networking.

Following is the presentation I used in case it can serve as a guide to readers:

Finally, this is to thank the AQuAS, the attendees for their interest and the Communications and Documentations Unit for organising this workshop .

From left to right and top to bottom: Maite Solans, Marta Millaret, Dolores Ruiz Muñoz, Bea Ortega, Emmanuel Giménez, Olga Martínez, Mercè Salvat, Paula Traver, Adela Zambrano, Maria José Tome, Laura Vivó

Post written by Paula Traver (@paulatraver), health sciences information specialist and social media manager.

The Observatory, gateway to health open data

14 Apr

Núvol Open dataThe information generated by the interaction of citizens and the healthcare system keeps increasing in size. Just to get an idea, last year, only in Catalonia there were nearly 45 million consultations in primary care centres, more than 700.000 patients were hospitalised, and over 150 million prescriptions were made. However, there is much more stored in administrative records (diagnostic tests, medical imaging, hospital prescriptions, expenditures, etc.) which are kept and managed in large databases. Government officials are responsible for the safe keeping of this information, and it may use it to improve the quality of healthcare and for healthcare planning purposes.

Furthermore, advances in the development, interoperability and crosslinking of the different information systems are making it easier to gather a large amount of data that will contribute to better characterise both the general and the patient population, and they are essential to assess the results of healthcare policies.

There is a wealth of opportunities with the increasing amount of data, all of them available in electronic formats and with more quality, and with the better linking between administrative databases. Thus, the information gathered leads to new ways of generating knowledge, especially when multiple data sources are combined (genetic, environmental, socio-economic, etc.) and made available to the citizens.

This turns information into a valuable asset for planning and assessment, but also for third parties, especially in research and in initiatives aimed at enhancing the use of open data.

Open data are a actually a philosophy, as they represent a practice that encourages the free access of data for everyone, without technical limitations. This means that the original files containing the data are available to the public in the most structured way as possible. This enables any computer system to read them, and even to easily develop software based on them.

This trend towards freeing the access to data is parallel to the need of the Catalan healthcare system of managing the whole life cycle of information, from the generation of information to the knowledge dissemination.

Information and communication technologies, and information systems become key strategic allies to achieve the above objectives, and to succeed in the integration, transparency, assessment and accountability by the healthcare system and its different actors.

In the case of Catalonia, the Autonomous Government is committed to a progressive disclosure of the available public data while respecting the privacy, safety and property limitations applicable in each case through the Open Data portal, where all data are indexed and characterised. This is done following the international trends regarding the disclosure of public data, and it counts with the advice from the W3C experts (World Wide Web Consortium).

The Department of Health is thus also joining the initiative of supporting free access to data and public information. This will enable to further advance towards an open government system, based on the values of transparency, service and efficiency, on promoting the generation of value through reusing public information, on easing the internal organisation of the information systems, and on fostering interoperability among the components of the healthcare system.

The Catalan Health System Observatory collaborates in this project by favouring the knowledge about the healthcare sector in Catalonia, and by supplying the citizens with health information to assess the healthcare system itself, to support decision-making and to favour transparency and accountability. With this objective, the Observatory is strongly determined to unveil to the general public all the information regarding their healthcare system. Along with other products, the Observatory publishes on its website a set of health and healthcare activity indicators, consisting of texts, charts and open data files.

Catalan Health System Observatory

Additionally, all the data published in the Observatory reports (Results Centre, Crisis & health, etc.) are also available to the public as open data formats and infographics.  Finally, the Observatory website provides a link to the open data portal and a collection of health open data available up to date.

Check the open data available at the Observatory website!

Open data gencat - open health data


Post written by Montse Mias (@mmias70) and Anna García-Altés (@annagaal).

Stratification and morbidity database (2n part)

31 Mar
Foto Emili Vela
Emili Vela

(This post is the second part of this post)

A key element for completing the stratification of population in risk groups is information system. It’s necessary to have a database that integrates information collected from different health records and therefore, in order to meet this demand, the population morbidity database was created.

The point is that every day there is more and more emphasis on the need to provide patients with a comprehensive and integrated health and social care, but the analysis and evaluation of this care can not be carried out correctly with fragmented information systems, on the contrary: it must be done starting from the integration of the data these contain.

Population morbidity database structure

The population morbidity database is based on a system of related tables that pivot around the users table, which includes the main data of the insured patient (demographics or health status, to name two examples).

Currently, there are three more tables: the diagnostic, the contact with health services and the pharmacy, but this type of structure relatively easily allows incorporating both information from new records (outpatient clinics, dialysis, respiratory therapy, etc.) and new tables with other relevant information, such as results of clinical findings:

Figure 2: Structure and content of the population morbidity database. The clinical determinations table in gray is not yet implemented.

Taula d'assegurats

The population morbidity database integrates information from the following records:

  • Registro Central de Asegurados – (RCA) (Central Registry of Insured Patients) managed by public relations management of CatSalut. This register basically provides all the information of residence, socio-demographics and health status of the insured patient.
  • Registros del conjunto mínimo básico de datos – (CMBD) (Records of basic minimum data set) managed by CatSalut Division of demand and activity analysis. These records feed both into the diagnoses table and in the contacts tables. There are different registers to collect information from the healthcare lines:
  • Hospitalization (CMBD-HA): information provided by general acute care hospitals (hospital admissions, outpatient surgery, home hospitalization, day hospital) from 2005 to 2014
  • Socio – sanitary (CMBD-SS): information of the care provided by the health centres of internment (long and medium stay and UFISS) and outpatient care equipment (PADES) from 2005-2014.
  • Psychiatric hospitalization (CMBD-SMH): information of the care provided by psychiatric hospitals from 2005-2014.
  • Outpatient Mental Health (CMBD-SMP): information of the care provided by outpatient mental health centres for the period 2005-2014.
  • Primary Care (CMBD-AP) information on the care provided by primary care teams from 2010 to 2014.
  • Emergency (CMBD-UR): information of emergency care (hospital and CUAP) from 2013 to 2014.
  • Pharmacy activity Log (RAF) managed by CatSalut’ management of pharmacy and medicine unit. This record provides all the information about outpatient pharmacy dispensing for the period 2011-2014.
  • Record health services turnover (RF) managed by the Division of care services provision. This record provides information on any activity financed by CatSalut, but that does not rely on a specific record: hospital outpatient clinics, dialysis, home oxygen therapy, rehabilitation or non-emergency medical transport. This record provides information mainly on the contacts table for the period 2011-2014.

The possible uses of the population morbidity database are multiple: the population stratification, the specific analysis of certain health problems (broken femur, IC, COPD,…), the development of population indicators of efficiency in the use of resources, etc.

We can conclude that, for the volume of data that integrates, this database has the characteristics of a structured “big data”, with a considerable capacity for growth and adaptation to new requirements and data sources and offers enormous possibilities for analysis.

Post written by Emili Vela, head of Modules for Tracking Quality Indicators (MSIQ). Health Care Area. CatSalut.